
Податотека:20210827 Global surface temperature bar chart - bars color-coded by El Niño and La Niña intensity.svg

Изворна податотека (SVG податотека, номинално 1.000 × 750 пиксели, големина: 9 КБ)
| Ова е податотека од Ризницата на Викимедија и може да се користи на други проекти. Подолу е наведена содржината на нејзината описна страница.
|
Опис
| Опис |
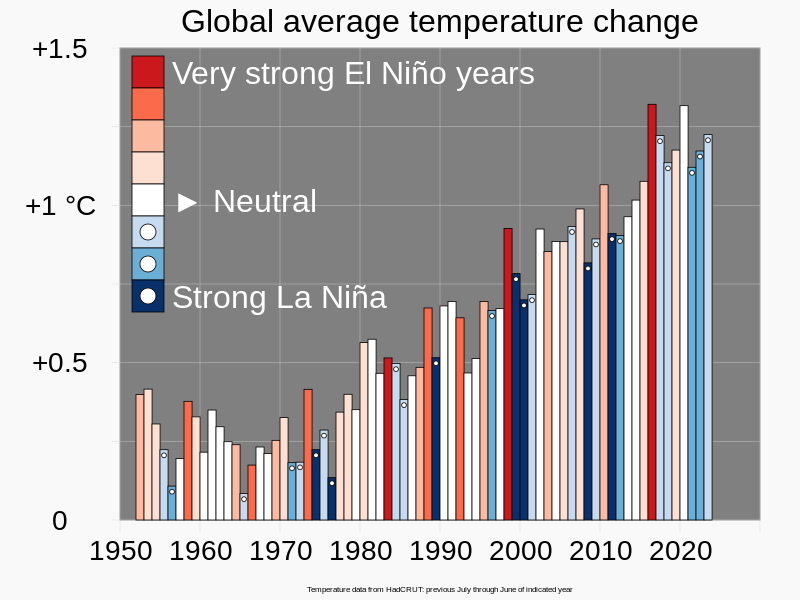
English: Bar chart of global surface temperature, with bars color-coded by El Niño and La Niña intensity.
Chart shows correlation of the (regional) El Niño–Southern Oscillation to global mean surface temperature. Suggested caption:
El Niño and La Niña intensity data is based on a year extending, roughly, from July of one year to June of the following year. Accordingly, I formed 12-month averages of global mean surface temperature anomalies from HadCRUT data extending from July to June, rather than the conventional calendar-year averaging. The height of each bar is determined by temperature change for that time period, and the color of the bar is determined by the El Niño and La Niña intensity category in that time period. The dark background, and black outlines of the individual bars, enable the colors to be seen more vividly. Circles were added to blue bars to help color-blind readers.
|
||
| Датум | |||
| Извор | сопствено дело | ||
| Автор | RCraig09 | ||
| Други верзии |
Изведени дела од оваа податотека: |


Лиценцирање
- Можете:
- да споделите – да го умножувате, распространувате и емитувате делото
- да преработувате – да преработувате
- Под следните услови:
- наведи извор – Ќе мора да дадете прикладен припис, да ставите врска до лиценцата и да укажете дали има направено промени. Ова може да биде направено на било кој разумен начин, но без да оддава впечаток дека лиценцодавецот стои зад Вас и Вашата употреба.
- сподели под исти услови – Ако го измените или преобразите делото, или пак ако основате друго дело на него, добиеното дело (придонесот) морате да го распространувате (објавувате) само под истата или складна лиценца на изворната.
Историја на податотеката
Стиснете на датум/време за да ја видите податотеката како изгледала тогаш.
| Датум/време | Минијатура | Димензии | Корисник | Коментар | |
|---|---|---|---|---|---|
| тековна | 20:32, 23 јули 2023 | | 1.000 × 750 (9 КБ) | RCraig09 | Version 8: MAJOR CHANGES: Adjusted temperature data to be measured with respect to "Pre-industrial levels" (1850-1900). Retained Japanese and Korean language translations in <switch> specifications |
| 16:03, 18 мај 2023 |  | 1.000 × 750 (11 КБ) | TAKAHASHI Shuuji | File uploaded using svgtranslate tool (https://svgtranslate.toolforge.org/). Added translation for ja. | |
| 10:38, 1 април 2023 |  | 1.000 × 750 (10 КБ) | Aspere | File uploaded using svgtranslate tool (https://svgtranslate.toolforge.org/). Added translation for ko. | |
| 22:00, 30 јануари 2023 |  | 1.000 × 750 (8 КБ) | RCraig09 | Version 5: update to include data through June 2022 | |
| 22:45, 27 ноември 2021 |  | 1.000 × 750 (8 КБ) | RCraig09 | Version 4: moving dots near ends of bars to make it easier to see different influence bars . . . making SVG coding a bit more compact | |
| 22:43, 27 ноември 2021 |  | 1.000 × 750 (8 КБ) | RCraig09 | Version 3: adding dots to La Nina bars for accessibility for color-blind people | |
| 07:32, 28 август 2021 |  | 1.000 × 750 (7 КБ) | RCraig09 | Version 2: Clarify that HadCRUT provided temperature data only | |
| 04:02, 28 август 2021 |  | 1.000 × 750 (7 КБ) | RCraig09 | Uploaded own work with UploadWizard |
Употреба на податотеката
Податотекава се користи во следнава страница:
Глобална употреба на податотеката
Оваа податотека ја користат и следниве викија:
- Употреба на cs.wikipedia.org
- Употреба на en.wikipedia.org
- Употреба на en.wikiversity.org
- Употреба на fa.wikipedia.org
- Употреба на ja.wikipedia.org
- Употреба на ko.wikipedia.org
- Употреба на ru.wikipedia.org