
Податотека:1951+ Percent of global area at temperature records - Seasonal comparison - NOAA.svg

Големина на овој PNG-преглед на оваа SVG-податотека: 800 × 560 пиксели. Други разделности: 320 × 224 пиксели | 640 × 448 пиксели | 1.024 × 717 пиксели | 1.280 × 896 пиксели | 2.560 × 1.792 пиксели | 2.000 × 1.400 пиксели.
Изворна податотека (SVG податотека, номинално 2.000 × 1.400 пиксели, големина: 23 КБ)
| Ова е податотека од Ризницата на Викимедија и може да се користи на други проекти. Подолу е наведена содржината на нејзината описна страница.
|
Опис
| Опис |
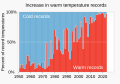
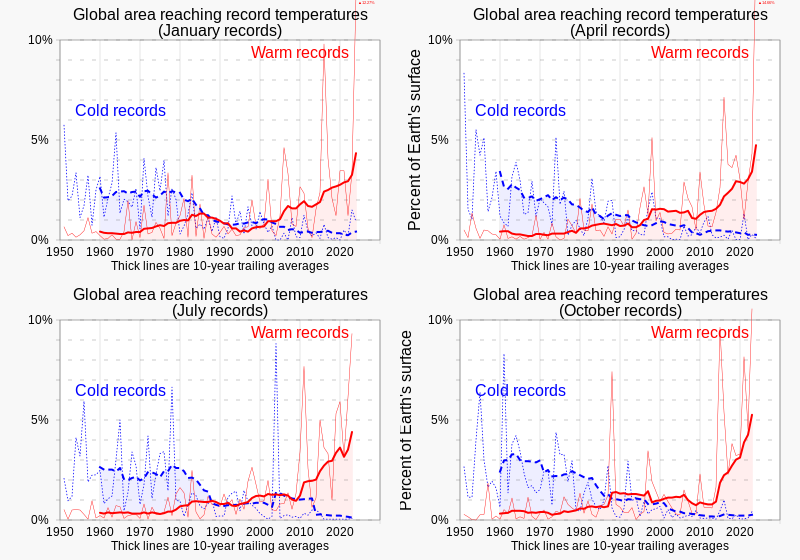
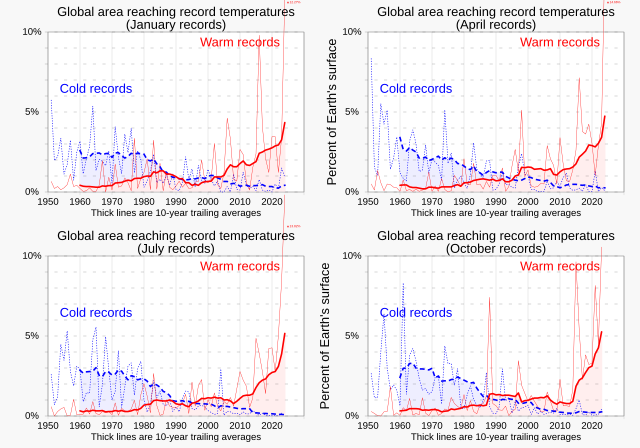
English: Charts comparing percentages of Earth's surface reaching record temperatures since 1951, comparing records for January, April, July and October, from NOAA data.
|
||
| Датум | |||
| Извор | сопствено дело | ||
| Автор | RCraig09 |

Related files
-
 01 January - Percent of global area at temperature records - Global warming - NOAA.svg
(January data) -
 02 February - Percent of global area at temperature records - Global warming - NOAA.svg
(February data) -
 03 March - Percent of global area at temperature records - Global warming - NOAA.svg
(March data) -
 04 April - Percent of global area at temperature records - Global warming - NOAA.svg
(April data) -
 05 May - Percent of global area at temperature records - Global warming - NOAA.svg
(May data) -
 06 June - Percent of global area at temperature records - Global warming - NOAA.svg
(June data)


-
 07 July - Percent of global area at temperature records - Global warming - NOAA.svg
(July data) -
 08 August - Percent of global area at temperature records - Global warming - NOAA.svg
(August data) -
 09 September - Percent of global area at temperature records - Global warming - NOAA.svg
(September data) -
 10 October - Percent of global area at temperature records - Global warming - NOAA.svg
(October data) -
 11 November - Percent of global area at temperature records - Global warming - NOAA.svg
(November data) -
 12 December - Percent of global area at temperature records - Global warming - NOAA.svg
(December data)


-
 1951+ Percent of global area at temperature records - Seasonal comparison - NOAA.svg
Seasonal comparison -
 1951 - Percent of global area at temperature records (monthly) - Global warming - NOAA.svg
All months scatterplot/dot plot -
 1951- RATIO of new record warm temperatures to new record cold temperatures (monthly) - Global warming.svg
Ratios scatterplot/dot plot (monthly) -
 1951- Percent of record temperatures that are cold or warm records.svg
 -
 1951- Warm and cold record temperatures - bar chart.svg

_-_Global_warming_-_NOAA.svg)
_-_Global_warming.svg)


Лиценцирање
Јас, праводржецот на ова дело, со ова го објавувам истото под следнава лиценца:
Оваа податотека е под лиценцата Криејтив комонс Наведи извор-Сподели под исти услови 4.0 Меѓународна.
- Можете:
- да споделите – да го умножувате, распространувате и емитувате делото
- да преработувате – да преработувате
- Под следните услови:
- наведи извор – Ќе мора да дадете прикладен припис, да ставите врска до лиценцата и да укажете дали има направено промени. Ова може да биде направено на било кој разумен начин, но без да оддава впечаток дека лиценцодавецот стои зад Вас и Вашата употреба.
- сподели под исти услови – Ако го измените или преобразите делото, или пак ако основате друго дело на него, добиеното дело (придонесот) морате да го распространувате (објавувате) само под истата или складна лиценца на изворната.
Историја на податотеката
Стиснете на датум/време за да ја видите податотеката како изгледала тогаш.
| Датум/време | Минијатура | Димензии | Корисник | Коментар | |
|---|---|---|---|---|---|
| тековна | 02:23, 24 февруари 2024 | | 2.000 × 1.400 (23 КБ) | RCraig09 | Version 7: Update to include chart showing data for January 2024 |
| 07:38, 16 ноември 2023 |  | 2.000 × 1.400 (24 КБ) | RCraig09 | Version 6: remove minor extraneous characters from October quadrant | |
| 07:34, 16 ноември 2023 |  | 2.000 × 1.400 (24 КБ) | RCraig09 | Version 5: Update with October 2023 chart | |
| 05:57, 15 август 2023 |  | 2.000 × 1.400 (26 КБ) | RCraig09 | Version 4: update to include July chart through 2023 | |
| 23:08, 30 јули 2023 |  | 2.000 × 1.400 (27 КБ) | RCraig09 | Version 3: Add April and October graphics, for four-season comparison | |
| 06:00, 29 јули 2023 | 2.000 × 700 (13 КБ) | RCraig09 | Version 2: re-centering some text strings | ||
| 00:37, 29 јули 2023 | 2.000 × 700 (13 КБ) | RCraig09 | Uploaded own work with UploadWizard |
Употреба на податотеката
Податотекава се користи во следнава страница:
Глобална употреба на податотеката
Оваа податотека ја користат и следниве викија:
- Употреба на bn.wikipedia.org
- Употреба на cs.wikipedia.org
- Употреба на en.wikipedia.org
- Употреба на ha.wikipedia.org
- Употреба на id.wikipedia.org
- Употреба на zh.wikipedia.org