Податотека:Post-Glacial Sea Level.png
Содржината на страницата не е поддржана на други јазици.
Од Википедија — слободната енциклопедија

Изворна податотека(1.813 × 1.088 пиксели, големина: 371 КБ, MIME-тип: image/png)

Врска до Ризницата Ова е податотека од Ризницата на Викимедија и може да се користи на други проекти. Подолу е наведена содржината на нејзината описна страница.
Заедничката ризница е складиште на слободно-лиценцирани слики и снимки. И Вие можете да помогнете.

Опис

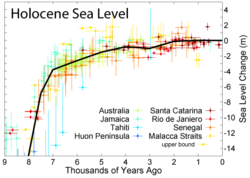
Expansion of the most recent 9 kyr

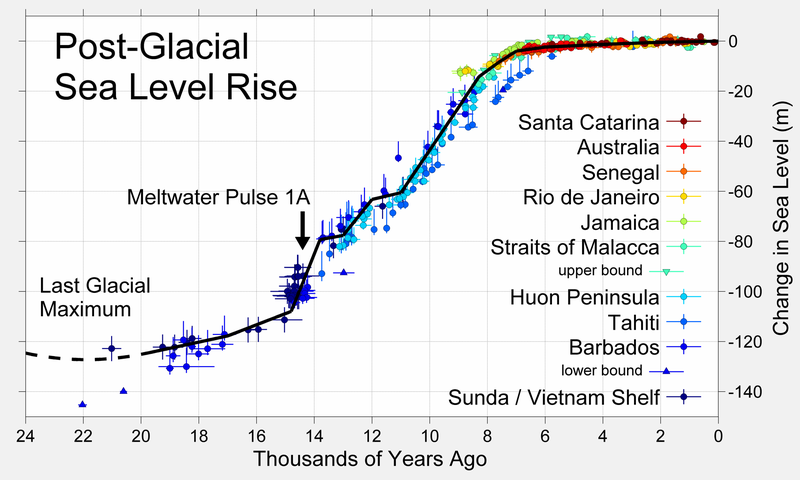
This figure shows sea level rise the end of the last glacial episode based on data from Fleming et al. 1998, Fleming 2000, and Milne et al. 2005. These papers collected data from various reports and adjusted them for subsequent vertical geologic motions, primarily those associated with post-glacial continental and hydroisostatic rebound. The first refers to deformations caused by the weight of continental ice sheets pressing down on the land the latter refers to uplift in coastal areas resulting from the increased weight of water associated with rising sea levels. Because of the latter effect and associated uplift, many islands, especially in the Pacific, experienced higher local sea levels in the mid-Holocene than they do today. Uncertainty about the magnitude of these corrections is the dominant uncertainty in many measurements of sea level change.

The black curve is based on minimizing the sum of squares error weighted distance between this curve and the plotted data. It was constructed by adjusting a number of specified tie points, typically placed every 1 kyr but at times adjusted for sparse or rapidly varying data. A small number of extreme outliers were dropped. Some authors propose the existence of significant short-term fluctuations in sea level such that the sea level curve might oscillate up and down about this ~1 kyr mean state. Others dispute this and argue that sea level change has largely been a smooth and gradual process. However, at least one episode of rapid deglaciation, known as meltwater pulse 1A, is agreed upon, and is indicated on the plot. A variety of other accelerated periods of deglaciation have been proposed (i.e. meltwater pulse 1B, 1C, 1D, 2, 3...), but it is unclear whether these actually occurred or merely reflect misinterpretation of difficult measurements. No other events are evident in the data presented above.

The lowest point of sea level during the last glaciation is not well constrained by observations (shown here as a dashed curve), but is generally argued to be approximately 130 ± 10 m below present sea level and to have occurred at approximately 22 ± 3 thousand years ago. The time of lowest sea level is more or less equivalent to the Last Glacial Maximum. Prior to this time, ice sheets were still increasing in size, so sea level had been decreasing almost continuously for approximately 100,000 years.

Copyright

This figure was prepared by Robert A. Rohde from published data, and is incorporated into the Global Warming Art project.

Image from Global Warming Art
This image is an original work created for Global Warming Art. Please refer to the image description page for more information.
GNU head Се дава дозвола за умножување, распространување и/или менување на овој документ под условите на ГНУ-овата лиценца за слободна документација, само Верзија 1.2 или било која понова верзија објавена од Фондацијата за слободна програмска опрема; без неменливи делови и без текстови на предни и задни корици. Примерок од лиценцата ќе најдете во делот наречен ГНУ-ова лиценца за слободна докуменација.
w:mk:Криејтив комонс
наведи извор сподели под исти услови
Оваа податотека е под лиценцата Криејтив комонс Наведи извор-Сподели под исти услови 3.0 Нелокализирана.
Можете:
  • да споделите – да го умножувате, распространувате и емитувате делото
  • да преработувате – да преработувате
Под следните услови:
  • наведи извор – Ќе мора да дадете прикладен припис, да ставите врска до лиценцата и да укажете дали има направено промени. Ова може да биде направено на било кој разумен начин, но без да оддава впечаток дека лиценцодавецот стои зад Вас и Вашата употреба.
  • сподели под исти услови – Ако го измените или преобразите делото, или пак ако основате друго дело на него, добиеното дело (придонесот) морате да го распространувате (објавувате) само под истата или складна лиценца на изворната.
Оваа ознака за лиценца е додадена на податотекава како дел од подновата на лиценците на ГЛСД.


References

  • Fleming, Kevin, Paul Johnston, Dan Zwartz, Yusuke Yokoyama, Kurt Lambeck, and John Chappell (1998). "Refining the eustatic sea-level curve since the Last Glacial Maximum using far- and intermediate-field sites". Earth and Planetary Science Letters 163 (1-4): 327-342. doi:10.1016/S0012-821X(98)00198-8
  • Fleming, Kevin Michael (2000) Glacial Rebound and Sea-level Change Constraints on the Greenland Ice Sheet, Australian National University PhD Thesis
  • Milne, Glenn A., Antony J. Long and Sophie E. Bassett (2005). "Modelling Holocene relative sea-level observations from the Caribbean and South America". Quaternary Science Reviews 24 (10-11): 1183-1202. doi:10.1016/j.quascirev.2004.10.005


Оваа слика (или сите слики од оваа страница/категорија) би требало бидат се преработи користејќи векторска графика со формат SVG. Тоа нуди неколку предности; видете „Податотеки за расчистување“ за повеќе информации. Доколку оваа слика веќе постои во SVG формат, тогаш подигнете ја. Откако ќе го направите тоа, заменете ја оваа предлошка со предлошката {{Vector version available|име на новата податотека.svg}}.

Описи

Опишете во еден ред што претставува податотекава

Предмети прикажани на податотекава

прикажува

Историја на податотеката

Стиснете на датум/време за да ја видите податотеката како изгледала тогаш.

Датум/времеМинијатураДимензииКорисникКоментар
тековна01:36, 19 март 2019Минијатура на верзијата од 01:36, 19 март 20191.813 × 1.088 (371 КБ)Dragons flightHigher resolution version
19:26, 25 ноември 2016Минијатура на верзијата од 19:26, 25 ноември 2016526 × 359 (19 КБ)A876edited to correct spelling. (also OptiPNG.)
04:20, 27 декември 2005Минијатура на верзијата од 04:20, 27 декември 2005526 × 359 (23 КБ)AngrenseSea level variation during the last post-glacial period. Source:English version of Wikipedia.

Податотекава се користи во следнава страница:

Глобална употреба на податотеката

Оваа податотека ја користат и следниве викија:

Погледајте ја останатата глобална употреба на податотекава.

Метаподатоци