
Податотека:Major cities threatened by sea level rise.png
Изворна податотека (1.425 × 625 пиксели, големина: 29 КБ, MIME-тип: image/png)
| Ова е податотека од Ризницата на Викимедија и може да се користи на други проекти. Подолу е наведена содржината на нејзината описна страница.
|
Опис
| Опис |
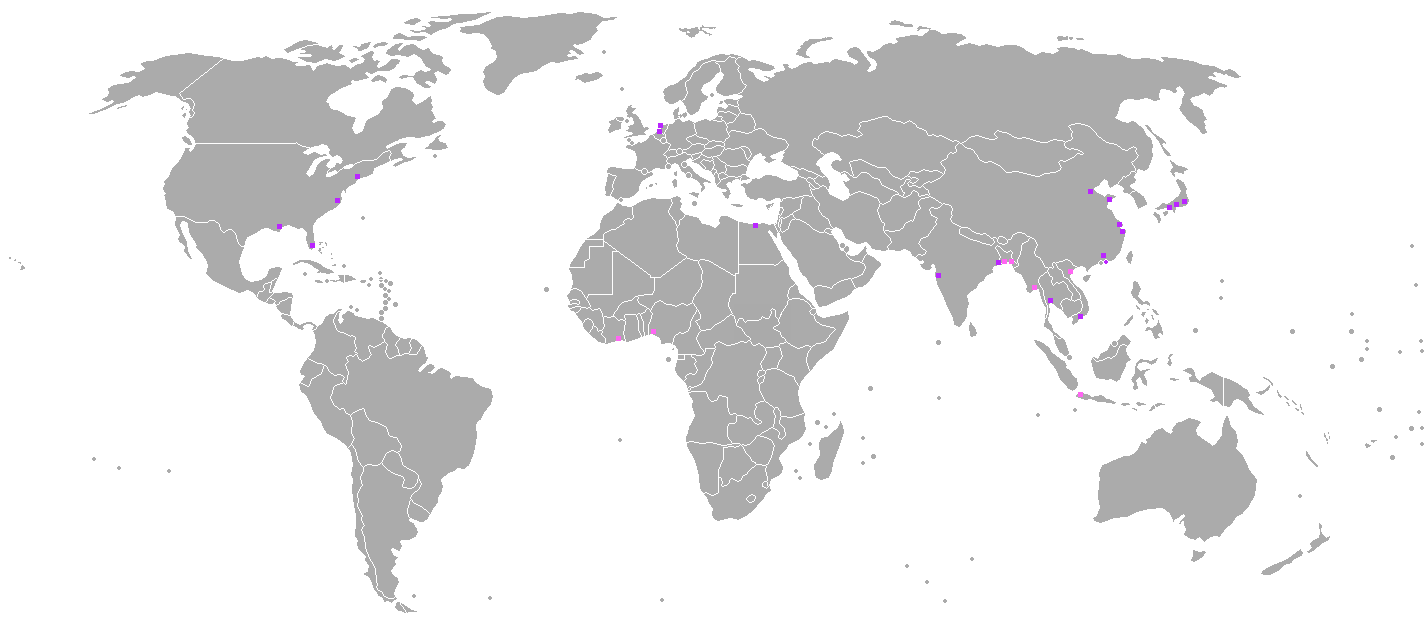
English: Map showing the major cities (in terms of assets and population) that are under threat by the rising sea level. The cities indicated are under threat of even a small sea level rise (of 1.6 foot/49 cm) compared to the level in 2010). Even moderate projections indicate that such a rise will have occured by 2060[1][2]
The map was based on data of a 2007 OECD report[3][4] The report also stated that the total value of the assets exposed in 2005 across all cities is about US$3,000 billion. The top 20 cities in the world in terms of assets exposed to coastal flooding was marked in purple; additional cities that are in the top 20 in terms of population exposed to coastal flooding were marked in pink (there are only 27 cities on the whole map since these cities that have the largest amount of assets exposed to it also have the most people exposed to it). The list of the top 20 cities exposed to coastal flooding is:
The list of 7 additional cities that are in the top 20 most-populous cities exposed to coastal flooding is:
|
| Датум | |
| Извор | сопствено дело |
| Автор | Genetics4good |
Лиценцирање
- Можете:
- да споделите – да го умножувате, распространувате и емитувате делото
- да преработувате – да преработувате
- Под следните услови:
- наведи извор – Ќе мора да дадете прикладен припис, да ставите врска до лиценцата и да укажете дали има направено промени. Ова може да биде направено на било кој разумен начин, но без да оддава впечаток дека лиценцодавецот стои зад Вас и Вашата употреба.
- сподели под исти услови – Ако го измените или преобразите делото, или пак ако основате друго дело на него, добиеното дело (придонесот) морате да го распространувате (објавувате) само под истата или складна лиценца на изворната.
- ↑ File:Projections of global mean sea level rise by Parris et al. (2012).png
- ↑ Sea level rise chart
- ↑ 2007 OECD report
- ↑ OECD report, shortened version
.png)
Историја на податотеката
Стиснете на датум/време за да ја видите податотеката како изгледала тогаш.
| Датум/време | Минијатура | Димензии | Корисник | Коментар | |
|---|---|---|---|---|---|
| тековна | 01:31, 11 јануари 2016 | | 1.425 × 625 (29 КБ) | Magog the Ogre | Reverted to version as of 12:52, 2 November 2013 (UTC) |
| 14:52, 2 ноември 2013 |  | 1.425 × 625 (29 КБ) | Genetics4good | User created page with UploadWizard |
Употреба на податотеката
Податотекава се користи во следнава страница:
Глобална употреба на податотеката
Оваа податотека ја користат и следниве викија:
- Употреба на en.wikipedia.org
- Употреба на en.wikiquote.org
- Употреба на es.wikipedia.org
- Употреба на ig.wikipedia.org
- Употреба на zh.wikipedia.org